STATE OF
ORIGIN
STATISTICAL INTERACTIVE
STATE OF
ORIGIN
STATISTICAL INTERACTIVE
STATE
OF ORIGIN
STATISTICAL INTERACTIVE
The State of Origin series is the annual best-of-three Australian rugby league football match series between two states. It is often referred to as Australian sport's greatest rivalry, the State of Origin series is one of Australia's premier sporting events, attracting huge television audiences and usually selling out the stadiums in which the games are played.
Fox Sports Lab wanted to create an interactive page where supporters are able to discover NRL State of Origin statistics for their favourite players from the past and present. Punters can explore, compare and learn about history of the players and their statistical results, including detailed graphs that compare various players together customised to specific categories chosen.
www.stateoforiginstats.foxsports.com.au/#compare-players
The State of Origin series is the annual best-of-three Australian rugby league football match series between two states. It is often referred to as Australian sport's greatest rivalry, the State of Origin series is one of Australia's premier sporting events, attracting huge television audiences and usually selling out the stadiums in which the games are played.
Fox Sports Lab wanted to create an interactive page where supporters are able to discover NRL State of Origin statistics for their favourite players from the past and present. Punters can explore, compare and learn about history of the players and their statistical results, including detailed graphs that compare various players together customised to specific categories chosen.
Try it here
The Images below are some low fidelity mock-ups of the project when it was a work in progress, these mock-ups were what the user interface was built around. The team and I worked on this project at an excellerated speed, in two weeks we managed to have the design completed and leave the majority of the allocated time to development.
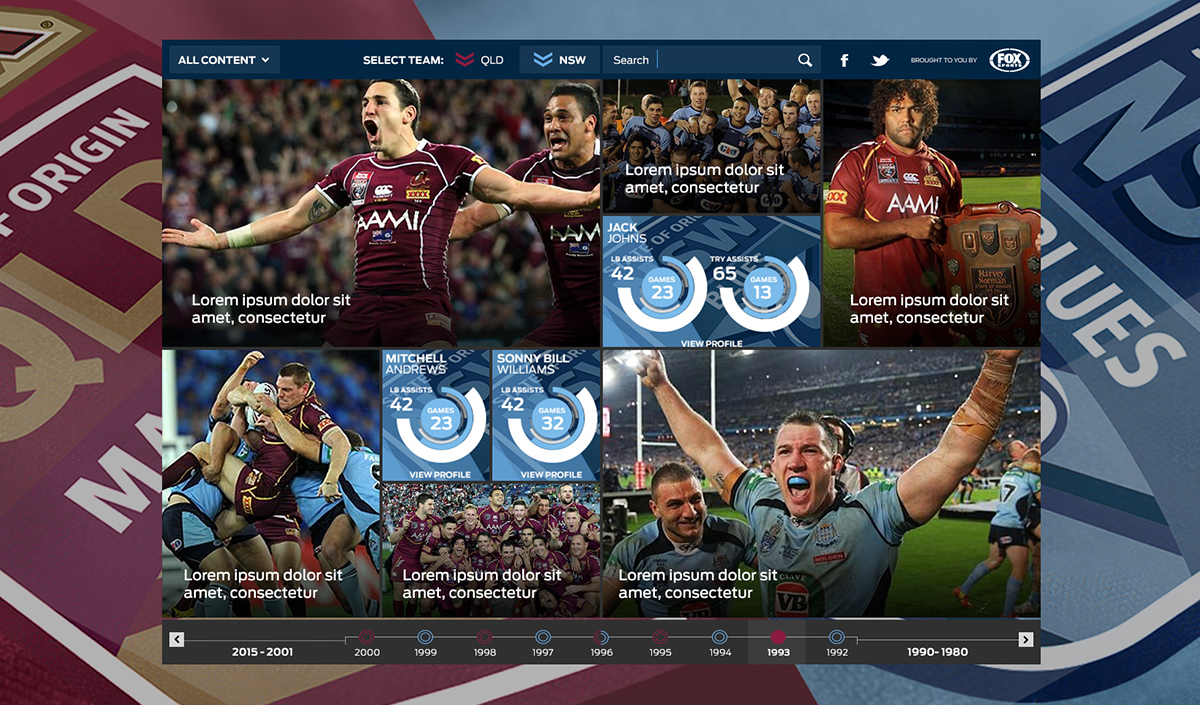
The State of Origin series is the annual best-of-three Australian rugby league football match series between two states. It is often referred to as Australian sport's greatest rivalry, the State of Origin series is one of Australia's premier sporting events, attracting huge television audiences and usually selling out the stadiums that the games are played in.
Fox Sports Labs (the statistics team) wanted to create an interactive page where supporters are able to discover NRL State of Origin statistics for their favourite players from the past and present. Punters can explore, compare and learn about history of the players and their statistical results. Data is shown in detailed graphs that can be customised through specific categories.
Try it here
The Images below are some low fidelity mock-ups of the project when it was a work in progress, these mock-ups were what the user interface was built around. The team and I worked on this project at an excellerated speed, in two weeks we managed to have the design completed and leave the majority of the allocated time to development.
The State of Origin series is the annual best-of-three Australian rugby league football match series between two states. It is often referred to as Australian sport's greatest rivalry, the State of Origin series is one of Australia's premier sporting events, attracting huge television audiences and usually selling out the stadiums that the games are played in.
Fox Sports Labs (the statistics team) wanted to create an interactive page where supporters are able to discover NRL State of Origin statistics for their favourite players from the past and present. Punters can explore, compare and learn about history of the players and their statistical results. Data is shown in detailed graphs that can be customised through specific categories.
Try it here
The Images below are some low fidelity mock-ups of the project when it was a work in progress, these mock-ups were what the user interface was built around.
The team and I worked on this project at an excellerated speed, in two weeks we managed to have the design completed and leave the majority of the allocated time to development.
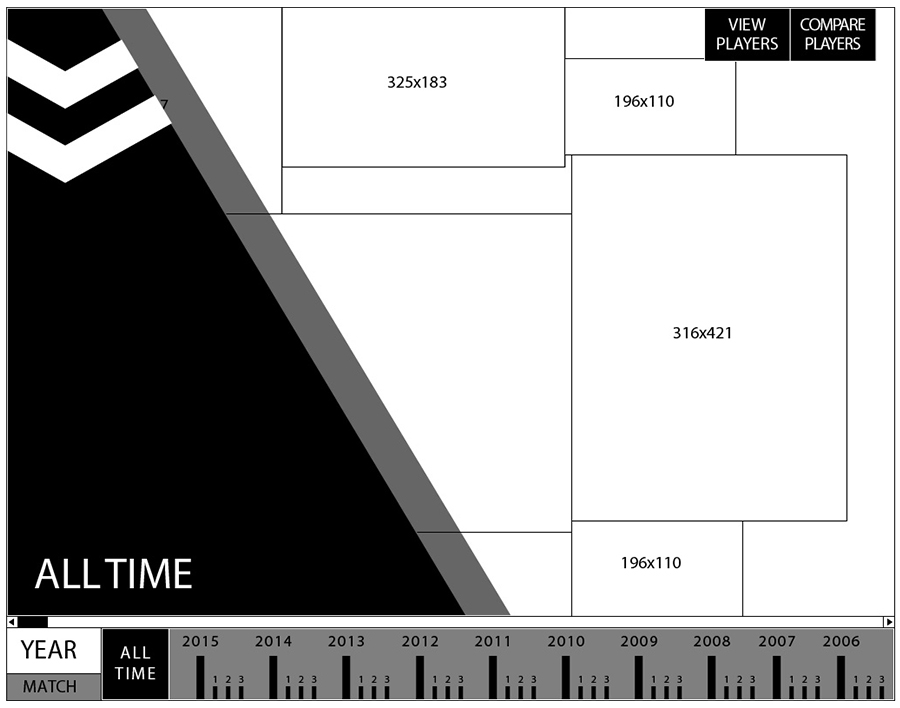
Homepage Wireframe with Header Banner
Homepage Wireframe with Header Banner
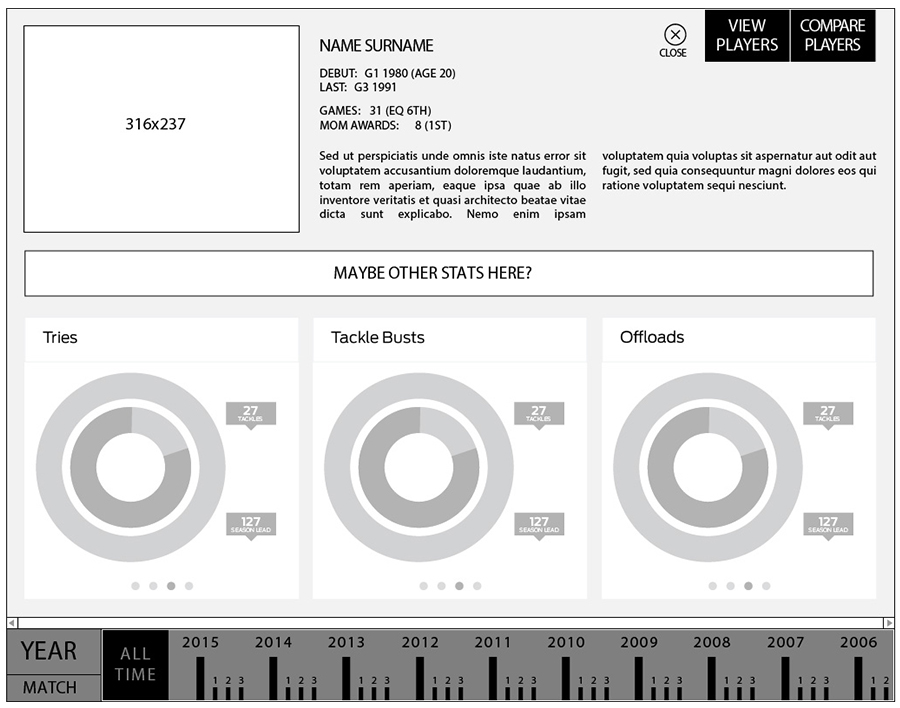
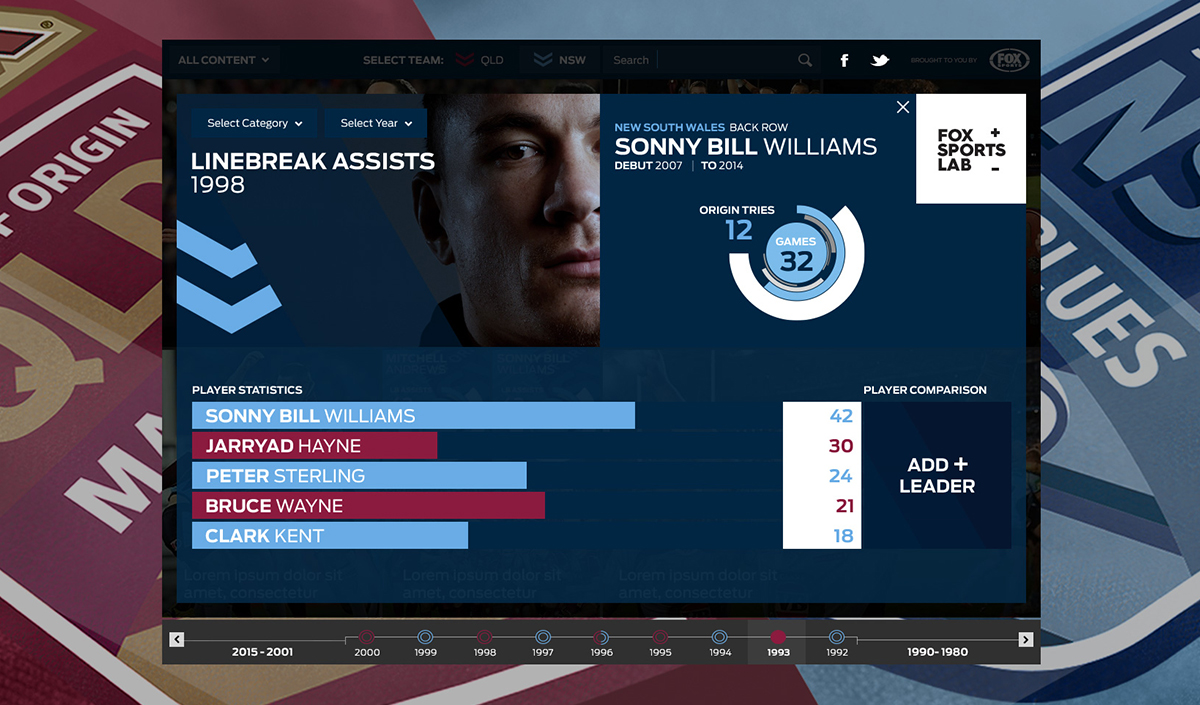
Player Card Wireframe
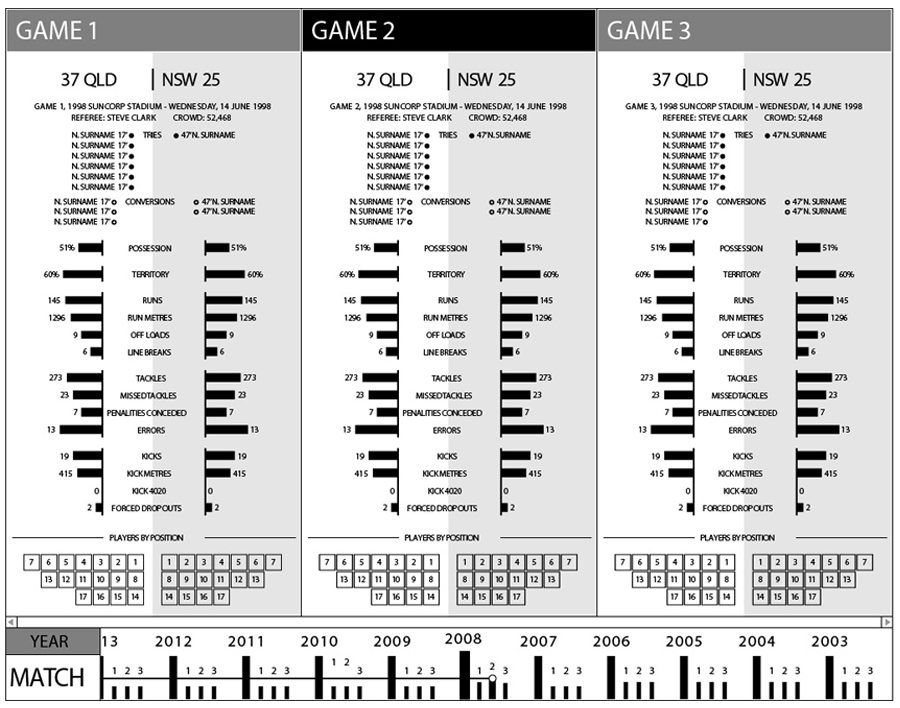
Game Card Wireframe
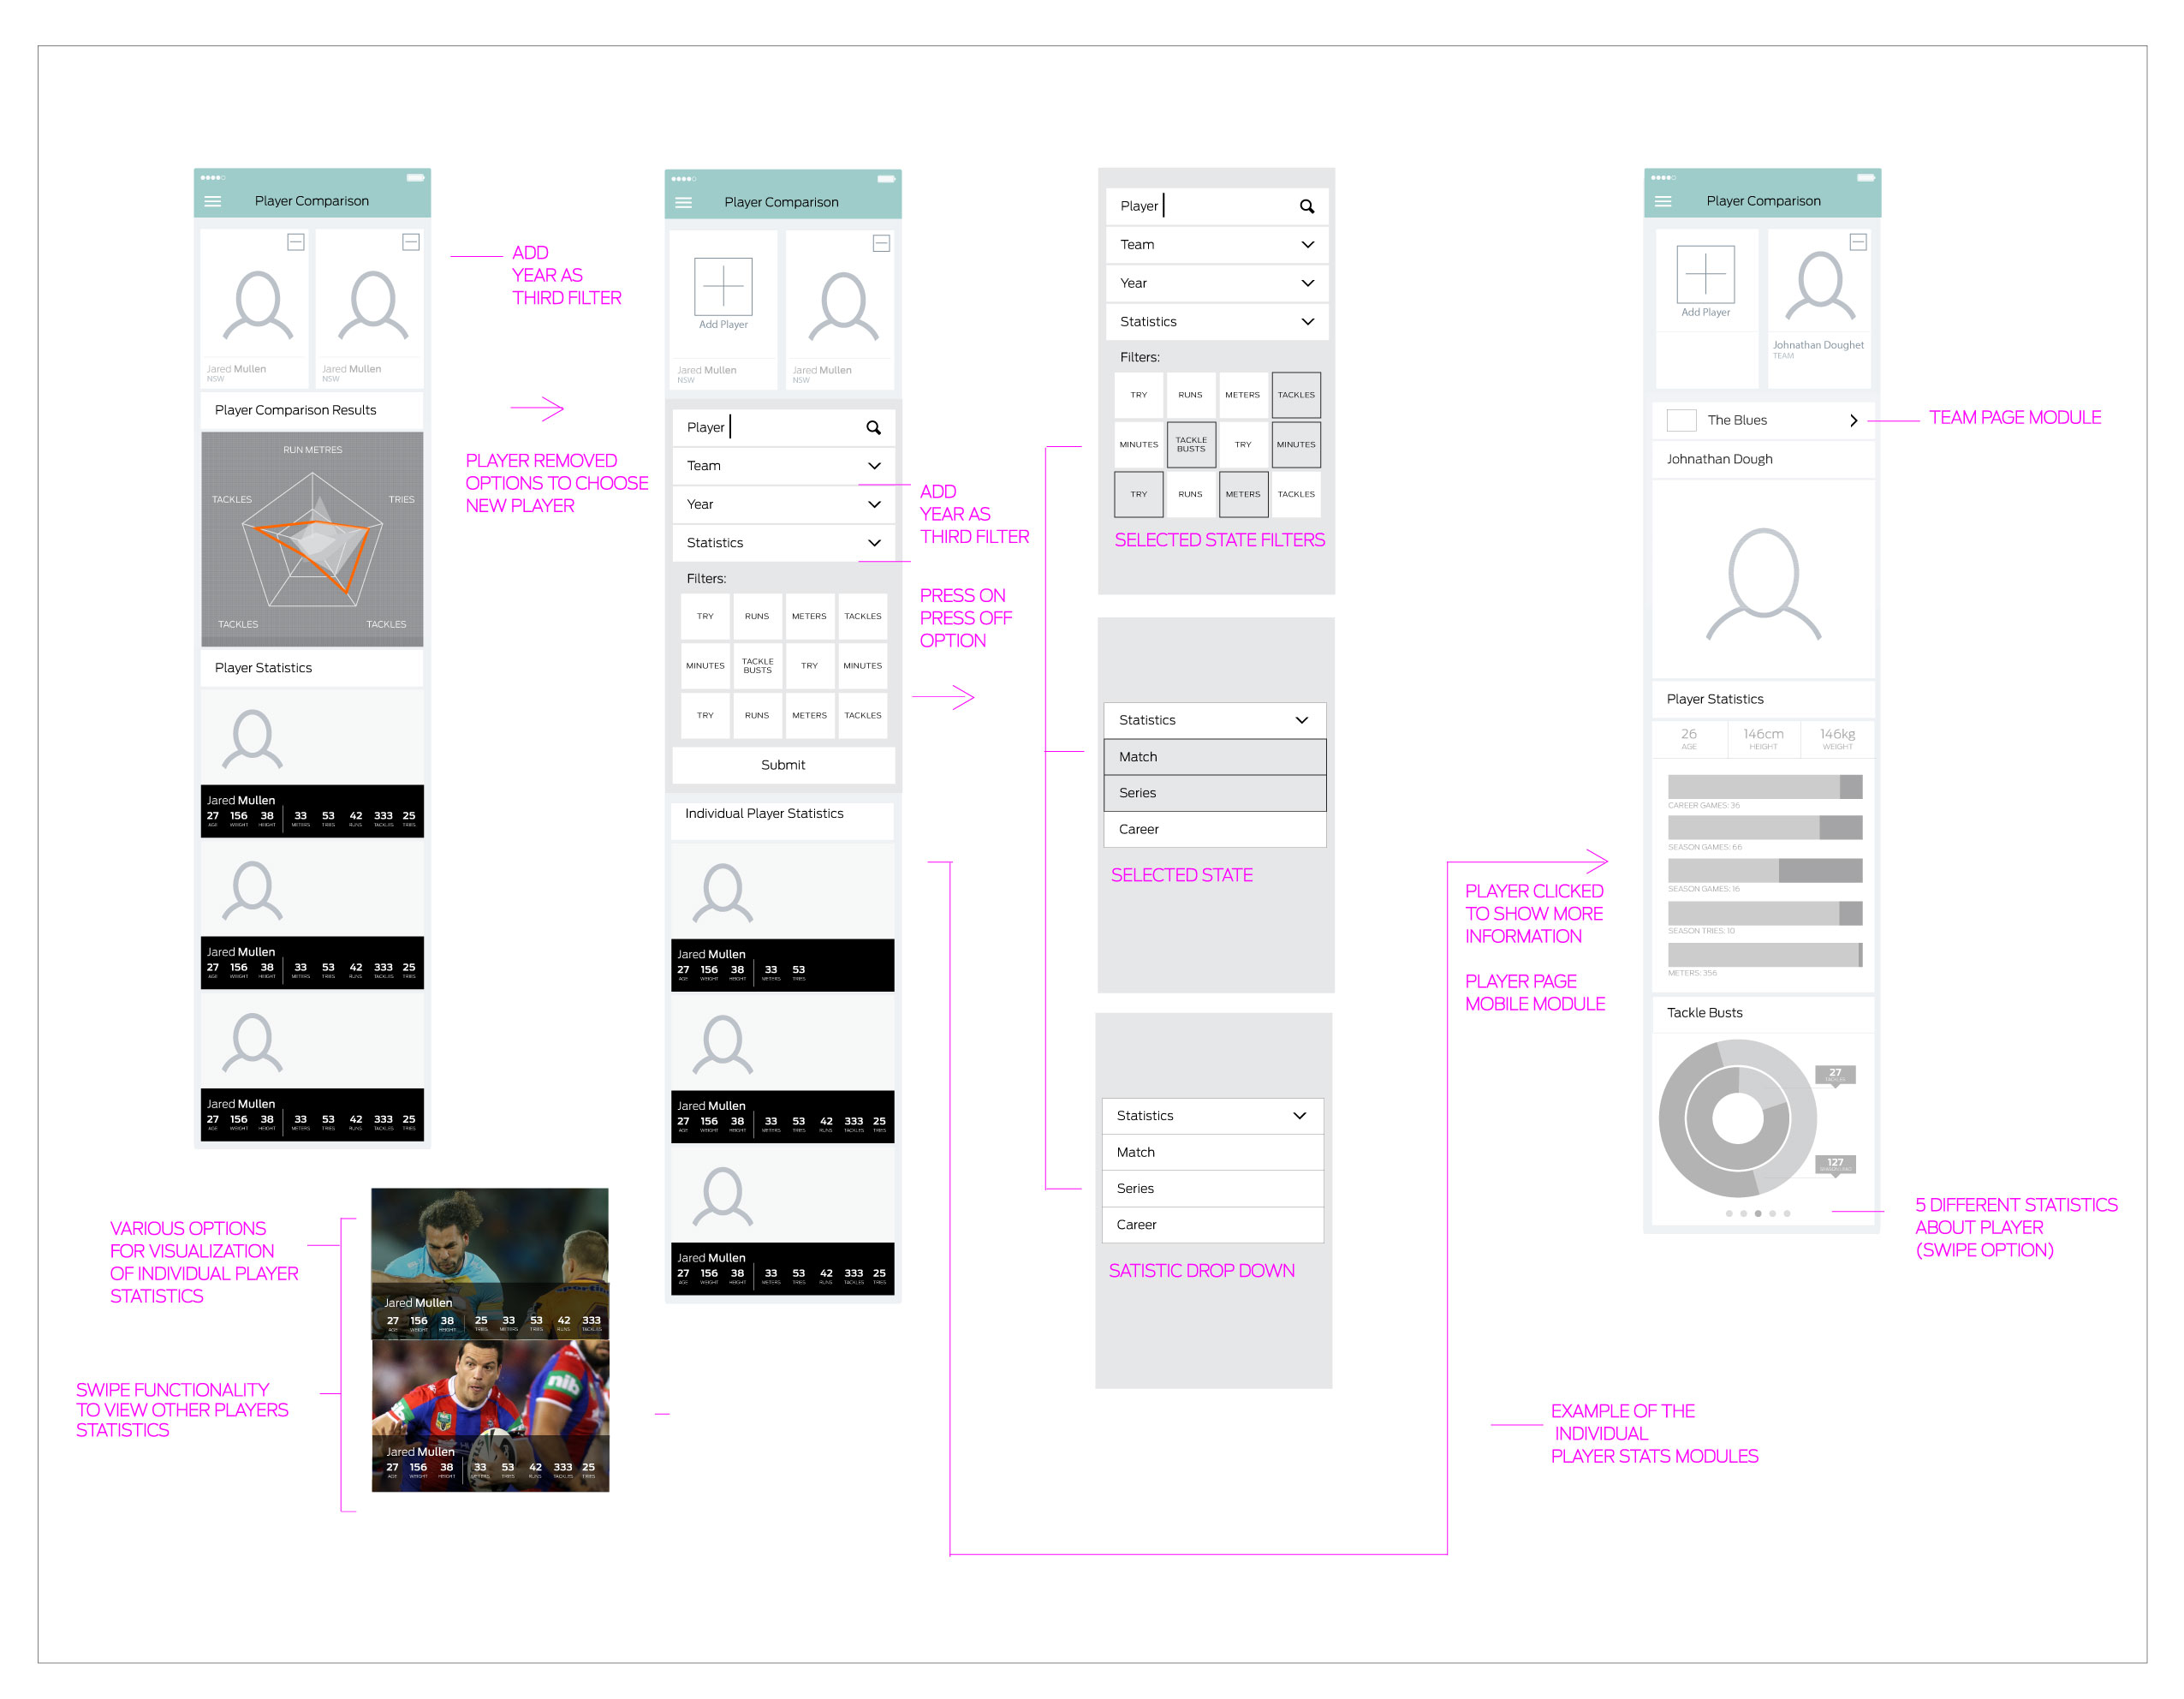
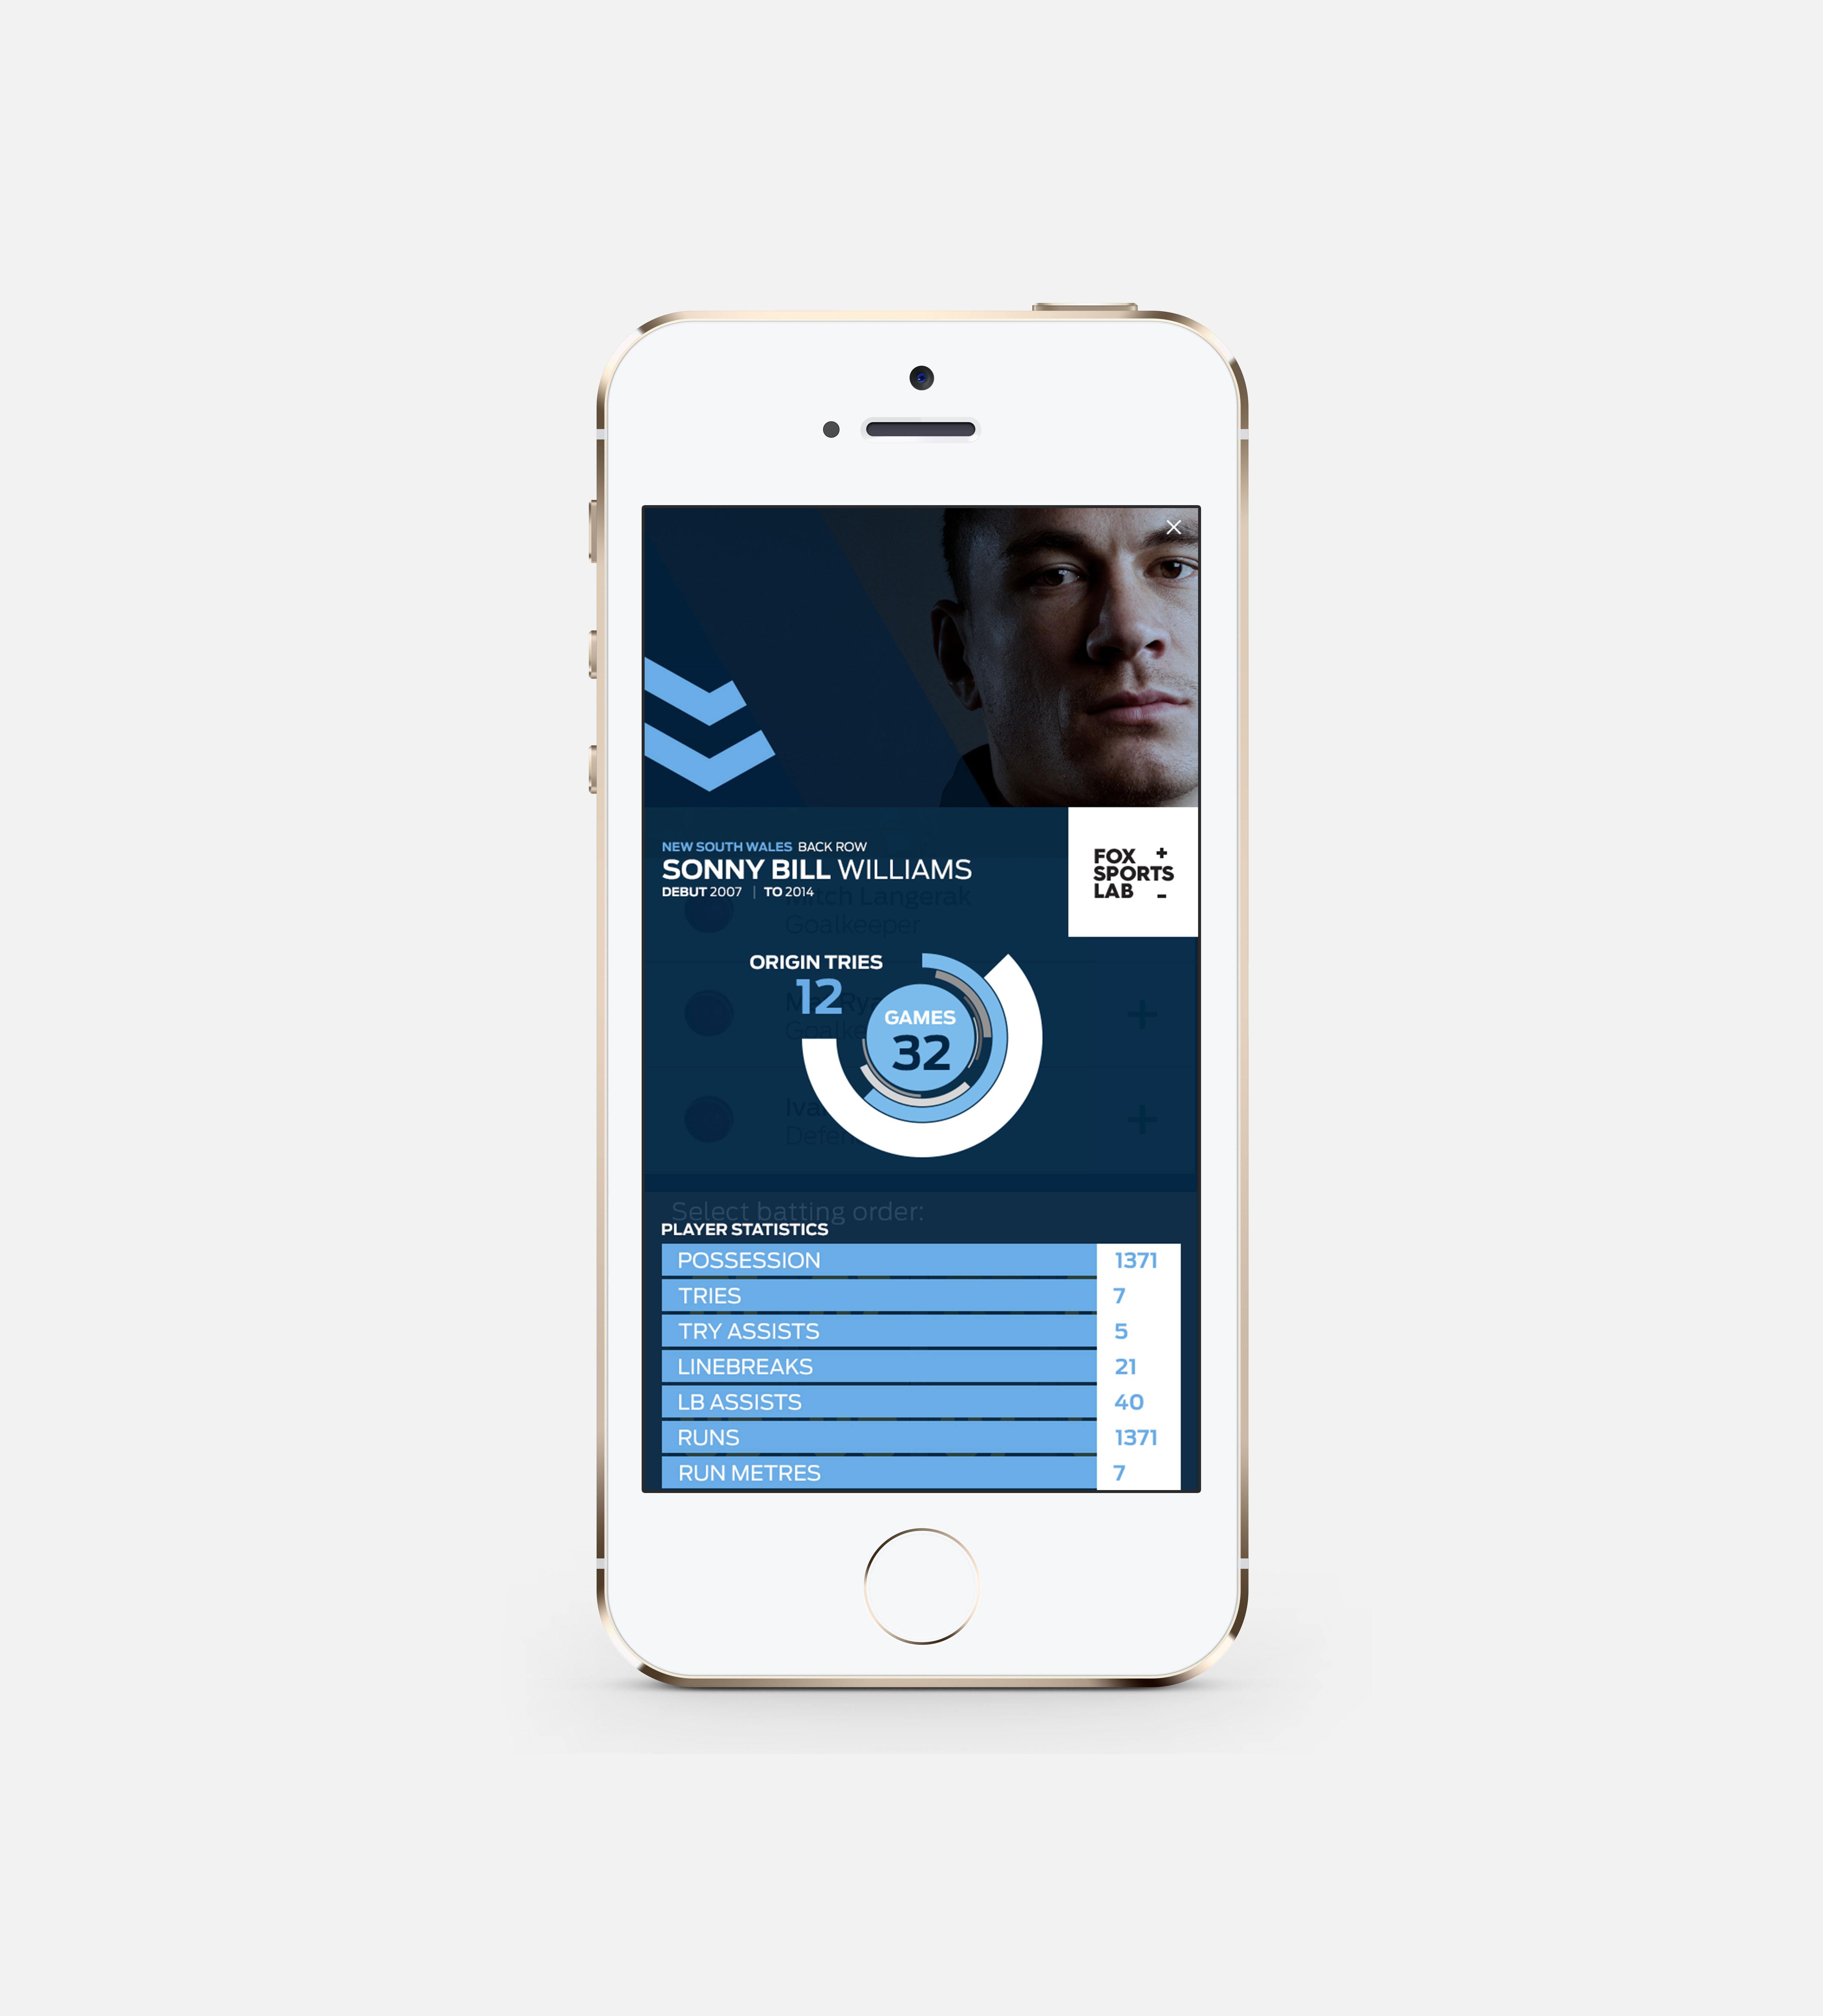
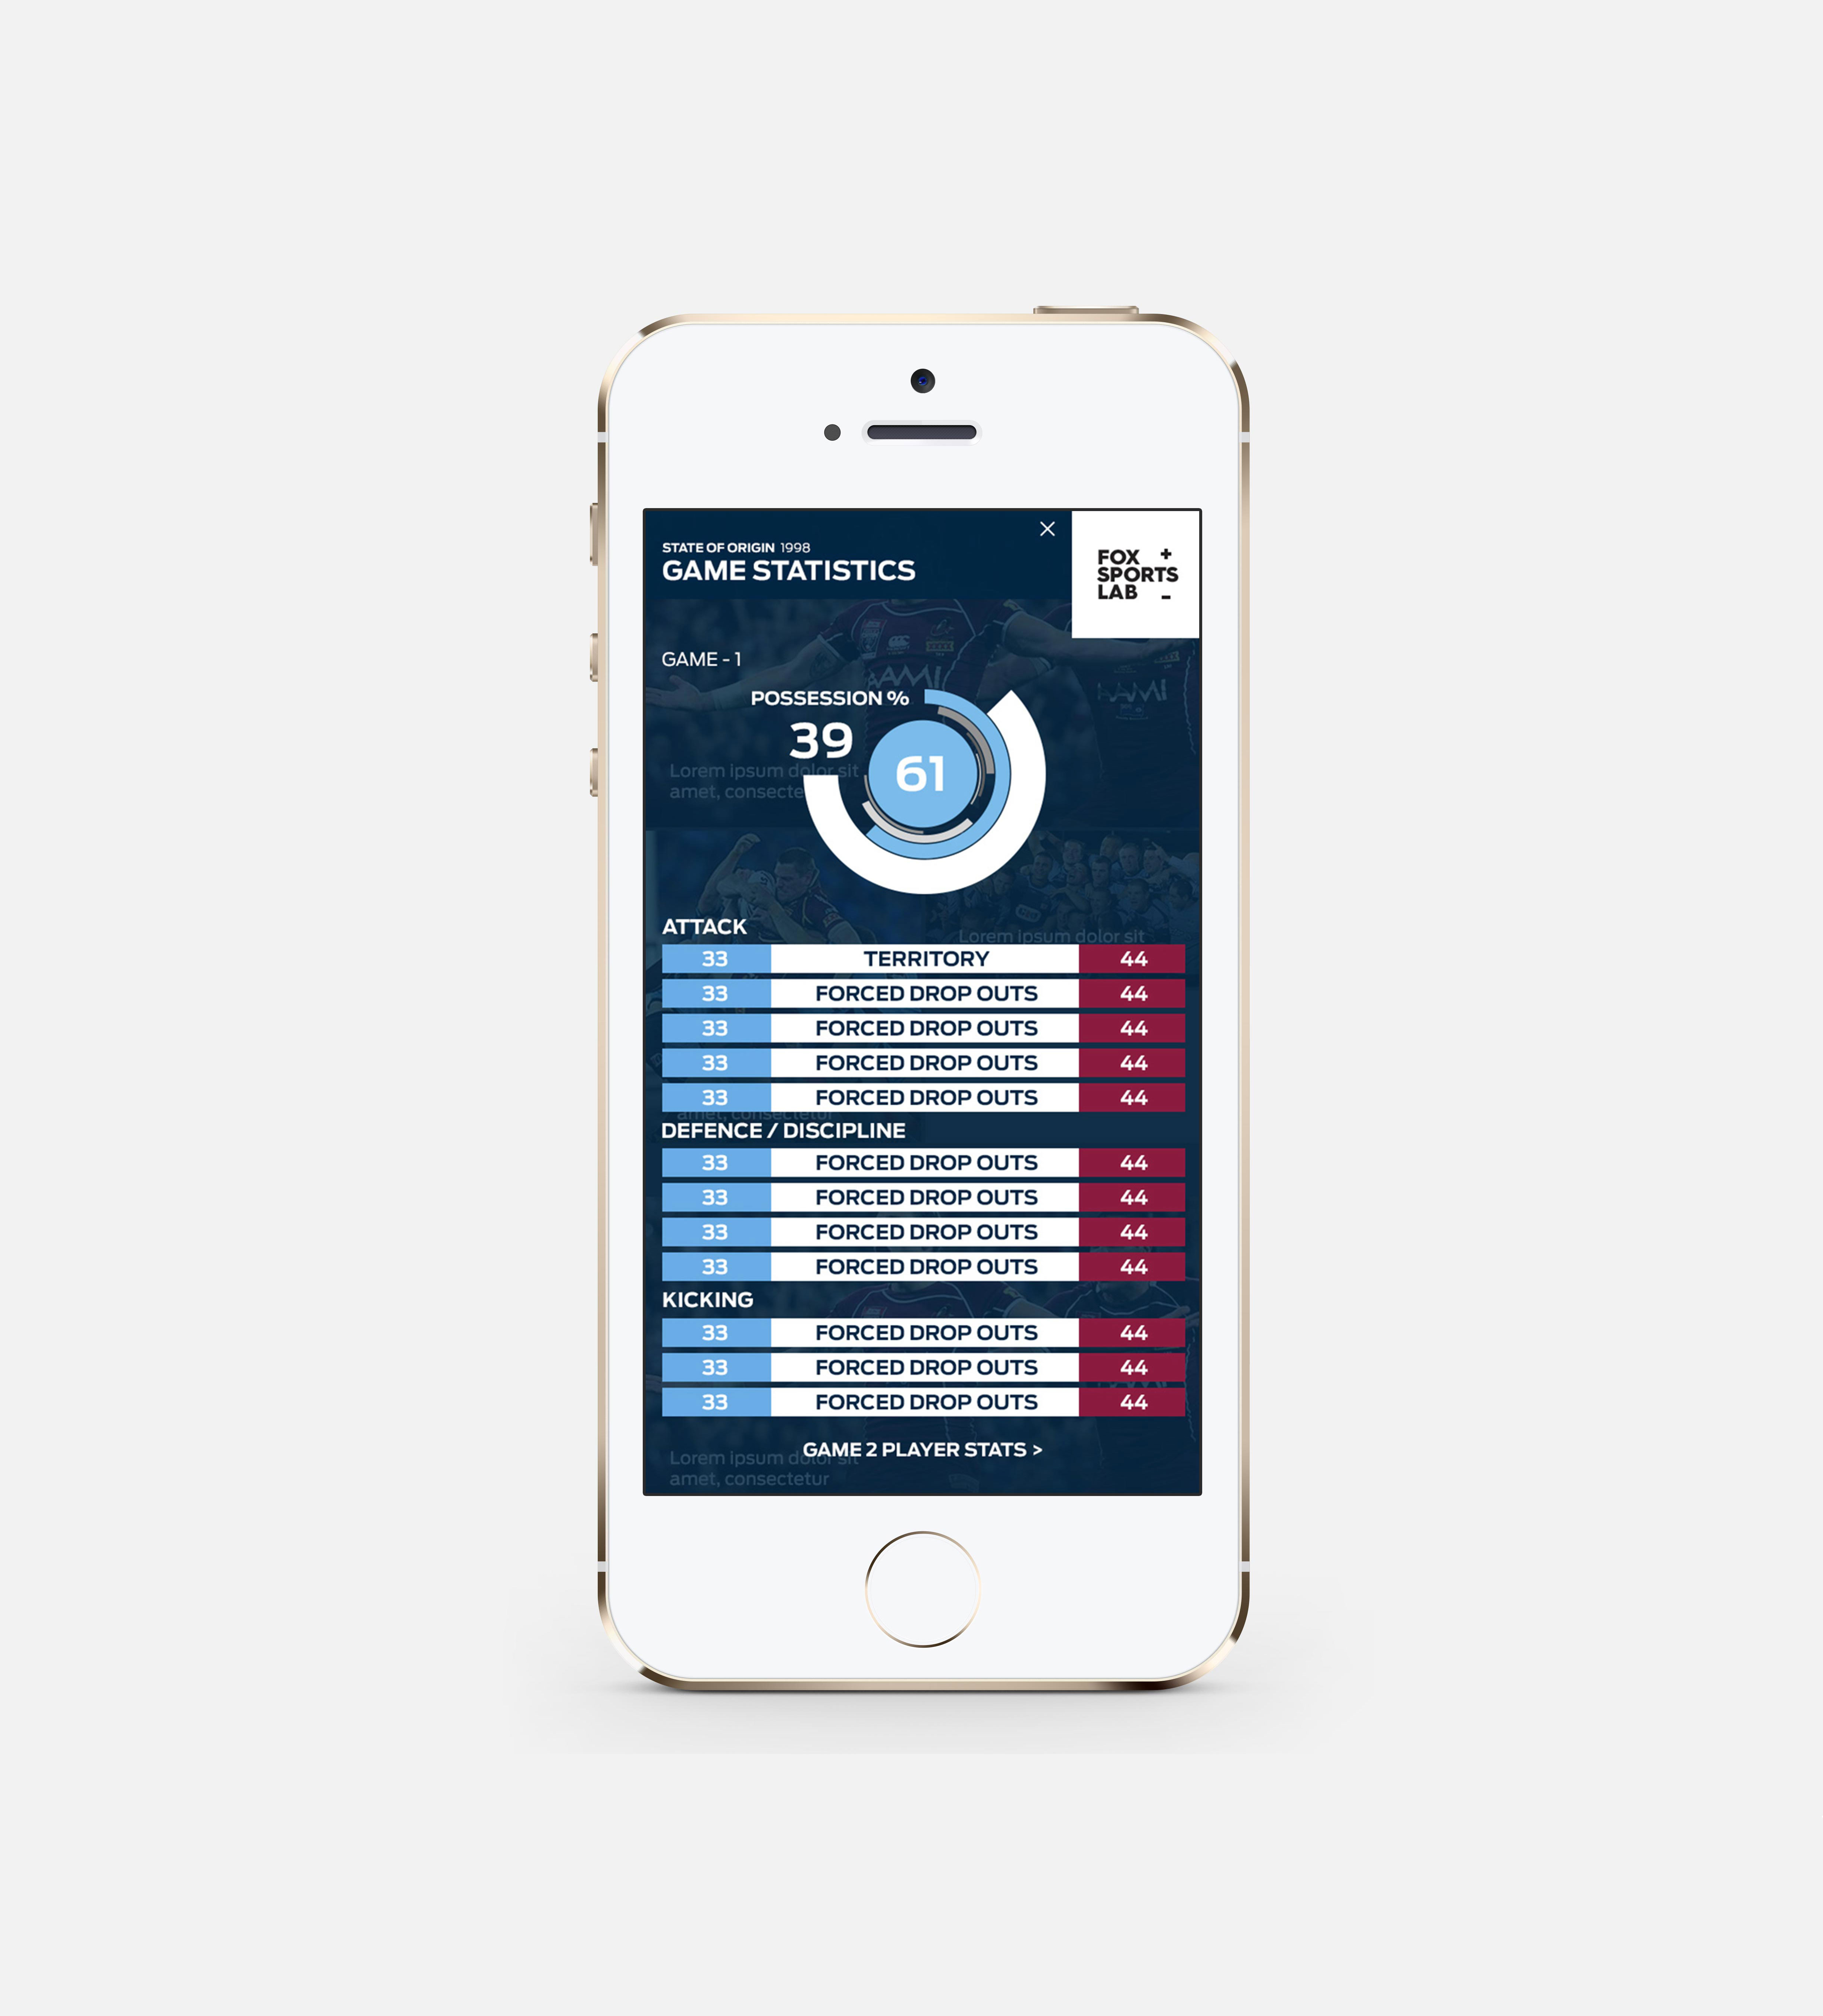
Mobile Wireframes
Mobile Wireframes
I worked with one other designer to create the high fidelity mock-ups to get the project to development on time. The team was great to collaborate with and whilst it was a high pressure undertaking it was great to get this across to development piece by piece.
The Front-End Developer we collaborated with was incredible to work with and, really took us through and made sure that every element was represented exactly as mocked.
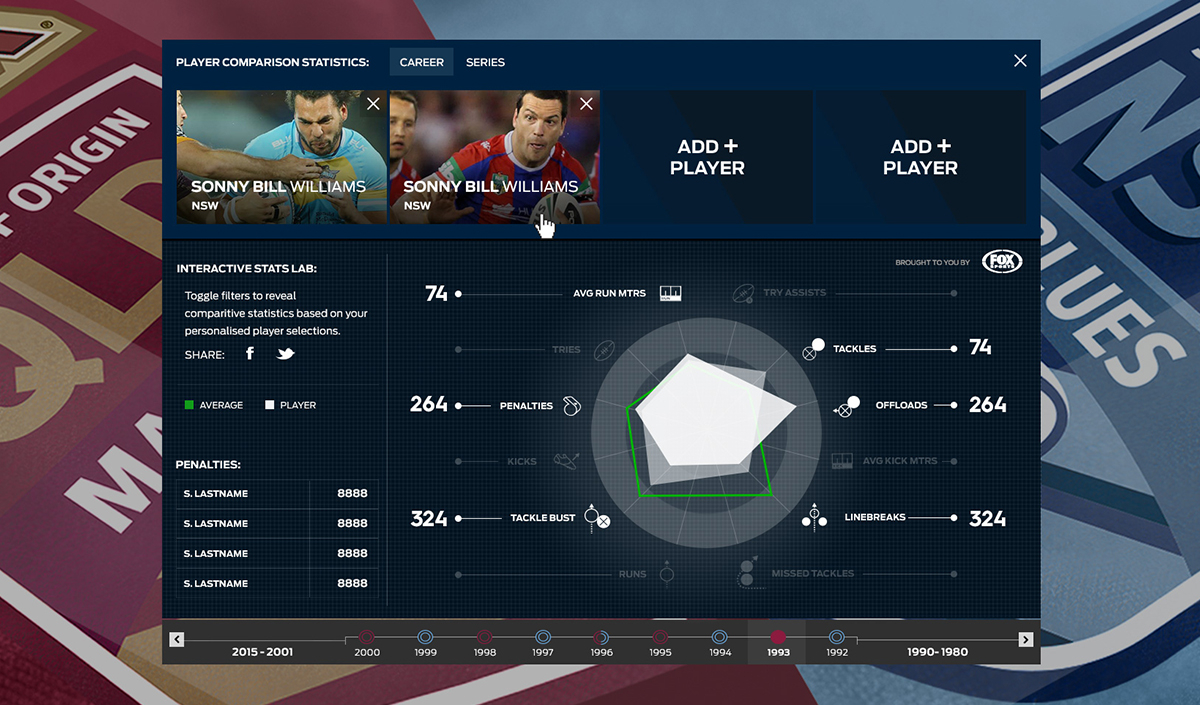
The hero of this project was the ability to compare players old and new to each other to reveal detailed statistics. We worked closely with the statistics team to make sure that we considered the variety of statistics available. The solution was a radar chart that plotted where each players statistics lay, and was highlighted when hovered on.
The result is a seamless design that works across all devices and is a testament to the whole team.
I worked with one other designer to create the high fidelity mock-ups to get the project to development on time. The team was great to collaborate with and whilst it was a high pressure undertaking it was great to get this across to development piece by piece.
The hero of this project was the ability to compare players old and new to each other to reveal detailed statistics. We worked closely with the statistics team to make sure that we considered the variety of statistics available. The solution was a radar chart that plotted where each players statistics lay, and was highlighted when hovered on.
The result is a seamless design that works across all devices and is a testament to the whole team.
I worked with one other designer to create the high fidelity mock-ups to get the project to development on time. Even though it was a high pressure undertaking, the team was great to collaborate with.
The hero of this project was the ability to compare players old and new to each other to reveal detailed statistics. We worked closely with the statistics team to make sure that we considered the variety of statistics available. The solution was a radar chart that plotted where each players statistics lay, and was highlighted when hovered on.
The result is a seamless design that works across all devices and is a testament to the whole team.